Here’s how musicians make money in one graph
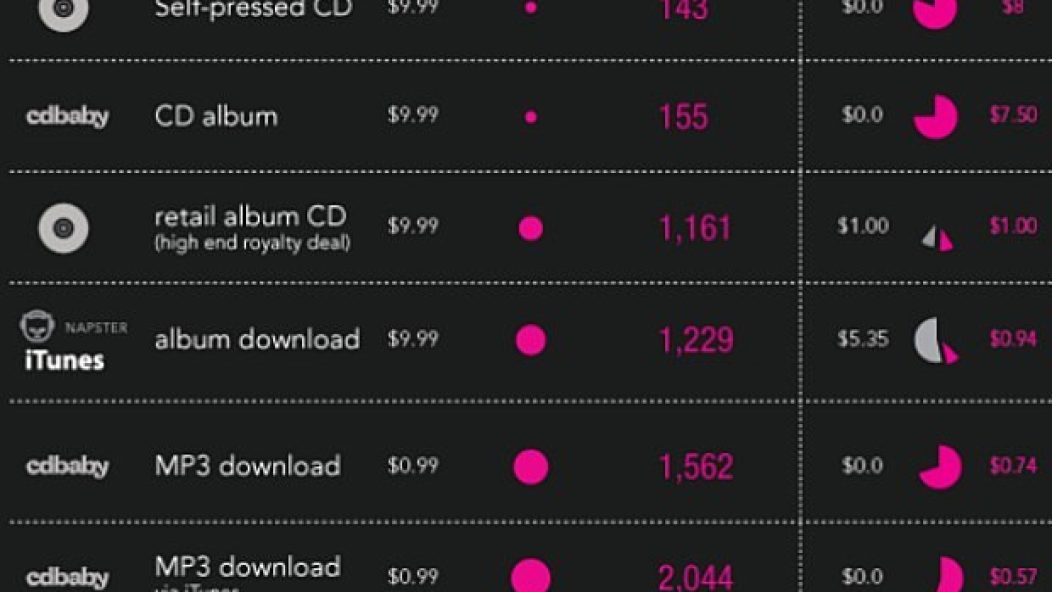
A few years ago, the Atlantic ran this really interesting graph that gives you a better sense of how musicians actually make money. The graph looks at everything from physical CD sales to digital downloads to streaming and charts the amount an artist would have to sell to actually earn the monthly U.S. minimum wage (in 2011) of $1,160. For instance, to earn that amount, an artist would need 4 million Spotify plays. Check out the graph below, and let us know your thoughts.
Keep in mind, these numbers are for a solo artist. In the case of a band, you’d most likely have to multiply that number by five.


Around Our Network